Foreign Investment And The Economy
- Bill Rosenberg
Speech, accompanied by Powerpoint, to CAFCA’s 40th anniversary event, Christchurch, 2/5/15.
The neo-liberal counterrevolution of Rogernomics and Ruthanasia of the 1980s and 1990s greatly increased New Zealand’s reliance on foreign investment in both its forms – financial investment in the form of debt, derivatives and portfolio investment on the one hand, and direct investment where firms are controlled by an overseas owner on the other. The result was a growing addiction. The income sent overseas by these investors has been the principal driver of New Zealand’s financial imbalance with the rest of the world – the current account deficit – which in turn requires more foreign investment in one form or another to pay for it.
Since the 2010/11 earthquakes here in Canterbury, you kind citizens have been of great assistance to the nation’s international liabilities. Insurance on damaged and destroyed infrastructure and buildings was largely reinsured overseas. Claims on insurance have led to a large inflow of capital. That has almost ended however, and we will be back to looking at not only the realities of the imbalances in New Zealand’s economy but also an outflow due to spending much of the insurance on imported products for the rebuild.
I want to look at these matters in a little more detail. I’ll first look at the state of New Zealand’s overseas liabilities. Then I’ll look at the drivers which will increase the liabilities. Finally I’ll look at what we could do about it and why it is getting more and more difficult to do anything effective. It turns out that foreign direct investment has been growing at a much slower pace since 2000 than during the 1990s, and in fact slower than the growth in the economy. On average, none of that growth was due to new money: it was mainly due to reinvestment of profits made here, with significant help from revaluations. But profit rates were higher during the 2000s and as a proportion of profits, reinvestment has not been generous. New data shows that about one third of all privately owned equity investment (shareholdings) in New Zealand is overseas owned.
We are helped by some new data that Statistics New Zealand has released over the last year which is more complete and gives considerably more detail than we had before – and hopefully more accurate. They still don’t go back far enough for my liking, but we now have more confidence about at least some statistics back to 1989, which is a useful stretch of our recent political and economic history. I don’t go into land ownership in any detail because I have done that elsewhere1.
Foreign Direct Investment
Foreign Direct Investment (FDI) is the most controversial type of foreign investment because it is where we most directly lose control of assets. Most (but not all) of CAFCA’s efforts over the years have been focussed on this kind of investment. It includes takeovers, privatisations, asset stripping, land purchases, and so-called “greenfields” investment where some new productive asset is actually created. You can see something of its history in the first graph (Figure 1) where the shaded area shows the “stock” of FDI (the value of what there is in New Zealand at any given time) in millions of dollars and the unbroken line shows it as a proportion of Gross Domestic Product (GDP – the size of the measured economy). At the bottom of the graph the dashed line shows the change in foreign direct investment each year.
In dollar terms FDI has increased on average by around $4 billion a year since 1989, reaching $107.7 billion in March 2014. However it rose faster during the 1990s, increasing an average $6.1 billion a year from 1989 to 2000, and then $2.6 billion a year from 2000 to 2014 (though $3.3 billion a year if the big fall in the year to March 2001 is excluded). There is a steeper increase in the second half of the 1990s – likely to be mainly takeovers and privatisations – with a peak increase of $12.2 billion in 1996 that has not been exceeded since then despite inflation. As will be seen, those changes don’t necessarily represent new investment and the types of investment have changed too.
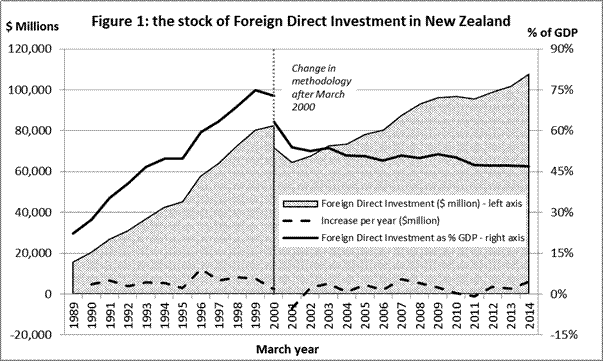
There were changes in methodology for estimating and recording FDI that took effect after March 2000, including a change in the definition of foreign direct investment. Until then an investment in a company was regarded as direct investment if overseas investors in total owned 25% or more of the company (similar to the Overseas Investment Act definition). After March 2000, an investment was treated as FDI only if it held 10% or more of the shares in the company. The result was that some investment was moved from FDI into Portfolio investment in the statistics, reducing the recorded extent of FDI and raising recorded Portfolio investment. The effect on flows of investment and income in and out of the economy is presumably similar. I have obtained data under both the old and current methodologies for March 2000 which allows us to see how much of the drop between March 2000 and March 2001 is due to the change in methodology and how much is real. The fall in recorded FDI due just to the change in methodology can be seen on the vertical line marking the change.
However there was still a real drop that year. Statistics New Zealand tell me there was significant restructuring of international assets and liabilities that year due to disinvestment from assets abroad, foreign investment in New Zealand, and the relocation of some New Zealand corporate head offices abroad. Overseas Investment Commission approvals for calendar year 2000 were one of the highest on record - $15.1 billion ($5.5 billion after taking account of sales from one overseas owner to another and partial New Zealand ownership), but this of course doesn’t record divestments. Recall that this is the year after the Labour/Alliance government took office, changing employment law and increasing top income tax rates which led to much grumpiness from business interests at the time. In the year to March 2001 there was a small net financial disinvestment of FDI of $242 million in terms of financial flows but that hides some record-setting movements. Foreign direct investors increased their investment by $4,416 million in new equity, $674 million in reinvested profits and $6,887 million more debt owed to the overseas parent – a total of $11,977 million. However, New Zealand direct investors sent a net $12,220 million out of the country repaying debt they’d borrowed from their overseas subsidiaries – and disposed of $13,369 million in equity. The financial flows don’t tell the whole story either: the stock of investment fell $7 billion between March 2000 and March 2001. This is discussed further below.
Between 2001 and 2008 until the Global Financial Crisis (GFC) hit cross-border investment throughout the world, the increase in FDI averaged $4 billion a year. The GFC led to FDI standing still in 2010 and falling in 2011 but since then, and especially in 2014 it has more or less resumed its previous pattern of increases. We’ve been talking here of the dollar increases each year. Because they’ve kept more or less constant and the economy has been growing over the 25 years since 1989, relative to the size of the measured economy in dollar terms (nominal Gross Domestic Product or GDP), FDI has actually levelled out with a gentle falling trend since 2001.This contrasts with the steep rise both in dollar terms and relative to GDP during the 1990s. It was particularly steep during the second half of the 1990s despite the late 1990s recession following the Asian financial crisis, as the unbroken line in Figure 1 shows.>
Is The Increase In FDI New Money?
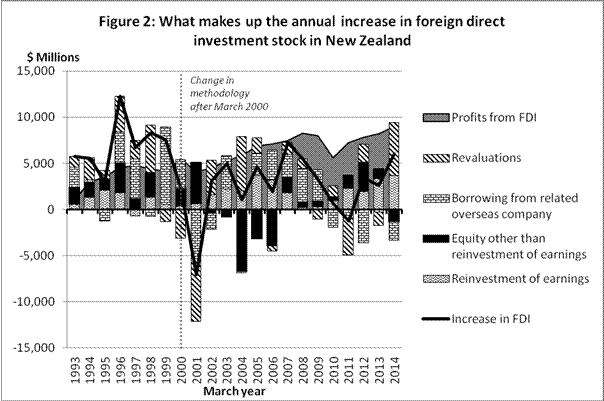
You might assume that the increase in FDI has come from actual inflows from overseas. In fact during the 2000s that was not the case, though it was during the 1990s. In principle, some of the increase can come from financial inflows, some from reinvestment of profits and some from changes in valuation of the assets. Revaluations can be because of changes in the exchange rate, because the market value of the investment has changed (or the firm’s accountants claim it has), the firm has gone out of business or for other reasons. Advocates of greater FDI like to say that it brings in new money and that much of the income from the investment – the profit – is reinvested. The statistics show this is not true in New Zealand. There are two distinct periods where the make-up of the increase in FDI has been very different2. This is shown in Figure 2.
The 1990s were distinguished by rapid growth in FDI, most of which was funded from new investment from overseas, and rapidly growing profits which however were low relative to the investment inflow. The growth in FDI was driven by privatisations and takeovers: the then Government’s Foreign Direct Investment Advisory Group (1997, p.6) reported in 1997 that privatisations accounted for approximately 42% of FDI in the decade 1986 to 1996. Further privatisations (such as more of the electricity system) continued after that. The great majority by value was takeover rather than new “greenfield” investment (Rosenberg, 1997).
Over this period (1993-2000), almost two-thirds of the increase in FDI (64%) came from new financial inflows from the foreign investors (the black blocks in the Figure) by way of either equity investment (shares) or lending to the subsidiary (debt), 22% of the increase was simply revaluation of the FDI (diagonally shaded), and the remaining 14% came from reinvested profits (wave pattern). Profits over this period were also growing rapidly as FDI increased (see the shaded background in Figure 2) but were considerably less than the increase in investment – in most years the level of profits was less than half of the increase in investment (the black line in Figure 2). A relatively low 24% of the profits were reinvested over this period to create 14% of the increase in FDI.However from 2001, the pattern was reversed. The growth in FDI was largely through reinvested profits, augmented by revaluation of the existing stock of investment. Remarkably, net new investment was slightly negative. Over this period, almost three-quarters of the increase in FDI (78%) came from reinvested profits while 24% came from revaluation of existing FDI. New investment was slightly negative – a net outflow – equivalent to 2% of the increase in FDI (so, slowing down its increase). Profits continued to grow, though not nearly as quickly as in the 1990s, but were on average twice the increase in FDI, the opposite of the 1990s. Of these profits, 29% was reinvested.
Reinvestment Is Not New Money
Advocates of FDI such as the Prime Minister speak of the reinvestment of profits as proof of the value of the investment. But reinvestment needs to be seen for what it is: it is not new money the investors are bringing into New Zealand but the earnings from New Zealand production, and it increases liabilities that divert future income from New Zealanders. If the firms were New Zealand owned there is no reason to expect that reinvestment would be any different and the earnings would stay in New Zealand. Further, as we have seen, since the 2000s profits have exceeded the annual increase in FDI by a considerable margin (about double the increase) and in fact, on average, only 29% of profits were reinvested.
Changes in FDI appear quite cyclical – that is, FDI changes appear to rise and fall with the fortunes of the economy. That may partly be because the dollar tends to fall when the economy grows more slowly or goes into recession, reducing the value of some overseas investment in New Zealand, but partly it’s because companies don’t want to invest during recessions. On the other hand, profits appear to rise with less variation. So, if anything, it exacerbates our balance of payments problems and the business cycle rather than smoothing them, though the dip in company profits during recessions – and the dip was substantial during the Global Financial Crisis – does provide some relief.
Foreign Direct Investment By Debt
A lot of the increase in FDI is not by increasing equity (shareholding) but by the local subsidiary borrowing from its parent (the brick pattern on the graph3). There are tax reasons for them raising capital through debt. Some companies like the Li Ka-shing-owned Wellington Electricity Ltd are heavily loaded with debt. Hong Kong based Li Ka-shing was listed by Bloomberg in 2014 as the wealthiest man in Asia and operates Wellington Electricity through the company Cheung Kong Holdings and the Bahamas-registered holding company Wellington Electricity Distribution Network Holdings Ltd. Wellington Electricity has yet to declare a profit. According to the 2014 financial report of its local holding company, Wellington Electricity Distribution Network Ltd, the group has $718 million of debt compared to assets valued at $895 million. Of that it owes $234.5 million to another Li Ka-shing company, British Virgin Islands-registered International Infrastructure Services Company Ltd, at an interest rate of 8.75%. It declared tax expenses of just $5.4 million in 2014 on a loss helped along by its interest expenses of $51.8 million – but in fact its accounts show no evidence of it paying any tax. The owners make their money from interest on the debt to the related party and hope for capital gains when they eventually sell the company in whole or in parts. Inland Revenue is supposed to be addressing this problem of so-called “thin capitalisation” – overseas owners loading up a subsidiary with debt to reduce taxation – and Wellington Electricity’s accounts say the tax recognising “thin capitalisation” would be $2.3 million. But, like the rest of its tax, it is “deferred” – that is: unpaid.
Wellington Electricity is just the most recent overseas investor to buy out the local Wellington lines company after its privatisation in the early 1990s, each sale leading to an upward revaluation and consequent demand for more profits. Economist Peter Harris, policy analyst Jim Turner and former Chair of the Greater Wellington Regional Council’s Utility Services Committee Dick Werry (Harris, Turner, & Werry, 2011) compared the performance of two local monopolies in Wellington: the privatised electricity company and the local water company which remained in local government ownership. They found that the operating expenses and depreciated historical values of the two operations were similar in 1990 but between 1990 and 2010 the costs of water supplies increased by just 17.5%, which is less than inflation, while the cost of the privatised electricity distribution increased by 295%. The huge increase in electricity distribution costs was largely to service a grossly inflated capital value of the electricity monopoly from about $180 million in 1990 to over $800 million in 2008 brought about through sale and resale of the company by successive private owners. There are obvious lessons here for Christchurch in considering the privatisation of its infrastructure, whether it’s the electricity company Orion or the port which it toyed with selling to another Li Ka-shing company in 2006.
How Much New Zealand Business Is Foreign Owned?
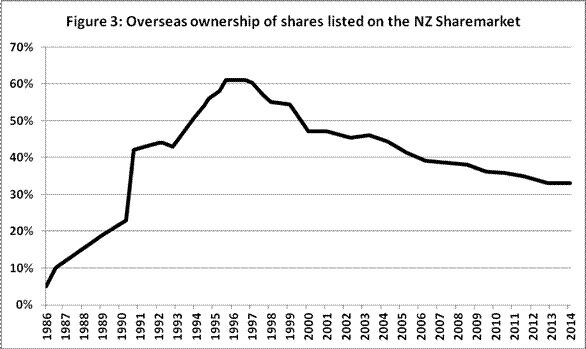
Our data on this is not very good and limited to equity investment (shareholdings) which doesn’t show the degree of control of the businesses (which can be achieved with as little as 10% of the shareholding) nor other forms of ownership such as direct ownership of land, but I’ll give you two answers on equity ownership. Firstly JBWere, a National Australia Bank/Goldman Sachs owned investment manager for the wealthy, does an annual survey of overseas ownership of shares publicly listed on the New Zealand Stock Exchange4. Along with previous surveys, this shows (see Figure 3) that it rose to a peak of over 60% in 1996 and 1997 but declined steadily from then to one third (33%) now, with some signs of flattening out.
However this omits unlisted companies; and some of the biggest companies operating in New Zealand are unlisted, including many of the subsidiaries of the largest transnationals and many large and small New Zealand companies. The following data comes from Statistics New Zealand, from work they carried out for the Reserve Bank, which has been refining its estimate of household wealth. I asked for the data for all sectors of ownership and they kindly obliged. This is the first time this has been made public and Statistics New Zealand warn that this is non-official data, work in progress and subject to revision5. It is comparing the equity (share ownership) part of FDI, plus foreign portfolio equity investment (small shareholdings), with equity ownership in the whole New Zealand economy (not including New Zealand ownership of overseas equity). It therefore excludes the within-group debt that I described above, but includes portfolio ownership. Data is not available to do a direct comparison of FDI and it is difficult to tell how this changes the picture. Unfortunately the data is only available from 1999, around the time when we know overseas ownership peaked. The raw data also has some double counting: I have removed the equity owned by corporates and banks because the value of the shares they own should be counted in the value of the shares of those entities themselves.
This data, in Figure 4, shows that the proportion of equity in New Zealand businesses that was owned overseas peaked at 49% in 2001, falling to a low of 23% in 2012 and then rising to 25% in 2013.
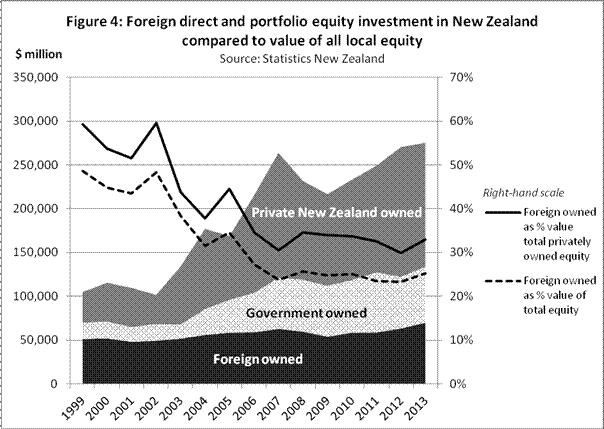
The data includes central and local government owned equity such as that in State Owned Enterprises like KiwiRail, local government owned ports, and partially privatised enterprises like the electricity companies. If we remove these to compare overseas ownership to total private ownership, the proportion of equity in private New Zealand businesses that was owned overseas peaked at 59% in 2001, fell to a low of 30% in 2012 and then rose to 33% in 2013, a remarkably similar picture to that given by the survey of listed shares.
Is FDI Worth It?
We’ll discuss in more detail below the income from FDI that is remitted to its owners overseas, but it receives a high rate of return compared to other forms of foreign investment and is a significant drain on New Zealand’s economy and earnings from overseas. Along with the income on other foreign investment (international debt) it is the main driver of our current account deficit, leading to increasing international liabilities in future. FDI carries greater risk of tax evasion and avoidance as seen in recent examples such as Google, Microsoft, McDonalds, Apple, Facebook and the Australian banks in New Zealand. While local businesses will try to avoid and evade tax too, the international operations and size of these corporations make avoidance and evasion much more feasible, cost-effective and difficult to police without international agreements empowering the cooperation and enforcement required.
Foreign investment, and particularly foreign direct investment, also brings risks of excessive and at times unwelcome political and economic influence through the size and influence of the corporations involved. They can also bring with them influence and pressure from governments of the countries in which they are based. So if we have all this costly FDI, what is the evidence that it is good for us? The fact that you are here probably means your answer to that is something along the lines “there isn’t any” and we heard a lot of contrary evidence yesterday at the event to announce the winners of the 2014 Roger Award. New Zealand’s experience has included asset stripping, extraordinary extraction of profits, run down of previously functioning firms, blatant tax evasion, and at times something close to fraud. It isn’t stopping, with private equity owners of one of our two largest private media companies, MediaWorks, getting it shipshape as an advertising channel with an eye to resale at the expense of public interest current affairs broadcasting. Some however might say, “that’s capitalism – are New Zealand capitalists any better?” Which you have to say isn’t a great defence of foreign investment! If you take that view – or the Polyanna one that business advocates regularly recite, that all FDI is good for us – then further discussion is either unnecessary or fruitless. But there is a more rational defence of FDI that we need to be able to answer which usually goes like this:
FDI can be desirable if it brings new capital, expertise unavailable in New Zealand, technology, knowledge spillovers to other firms and workers (that is, other firms learn from what the overseas companies do, and workers pick up skills and experience they wouldn’t otherwise get), and linkages into the local economy that multiply its developmental effects through local firms producing materials, components or services for the overseas owned firm or distributing and marketing its products. While the international literature refers to these as benefits of foreign direct investment, the question as to whether they are actually present in New Zealand should be evaluated as an empirical matter. In fact they are often weak in New Zealand.
Asset Stripping & Leveraged Buyouts
For example well-respected local researchers Richard Fabling and Lynda Sanderson (2011) found that “foreign firms tend to target high-performing New Zealand companies" but that “positive effects do not extend to productivity growth” unless the acquired company was originally capital-shallow. “Overall, the New Zealand research echoes the theoretical ambiguity …while foreign acquisitions generate potential for positive effects on domestic firms, these positive outcomes are not guaranteed and depend heavily on the motivation of the new foreign parent". They show a fall in capital/labour ratios after acquisition of high capital-intensity firms (Table 6, p.18) which is consistent with asset-stripping and leveraged buyouts which have been common in the last two decades.
In research published in 2014 by the Ministry of Business, Innovation and Employment (MBIE), Tinh Thanh Doan, Krishna Iyer and Dave Maré (2014) looked for increased productivity through three types of potential spillovers: within industry, from foreign-owned customers and from foreign-owned suppliers. They concluded: “We find little evidence of substantial positive spillover effects from FDI to local firms’ productivity”. The same year, Sanderson, Maré and Trinh Le (2014) found that in contrast to international experience, which shows significant wage premiums for working in foreign-owned firms, the wage premium in New Zealand is only 2.7% to 3.5% after taking account of factors such as firm size, location, industry, and the tendency of such firms to hire more highly skilled workers. They comment: “These findings give little support to the argument that foreign firms provide substantial indirect or spillover benefits to domestic firms through human capital accumulation and labour mobility”.
An Inland Revenue Department (IRD) analysis of Management’s top-200 non-bank firms (Benge, 2010) showed much higher rates of profit to foreign firms compared to local firms (return on equity of 26% compared to 12% and return on assets of 16% compared to 10%), but that was not matched by the firms’ export performance. They were largely in areas with a low proportion of exports. This led IRD to suggest that these firms were concentrated in areas of the economy with location-specific rents – that is, areas not exposed to international competition and with dominant market positions where they could pump up their prices and profits. The evidence is therefore that while they bring substantial financial gains to their owners, overseas owned firms do little to contribute new FDI finance or to improve New Zealand’s productivity, technology, knowledge spillovers, linkages and capability, but lead to an increase in our international liabilities.
Other Forms Of Foreign Investment
So far I have discussed only FDI in detail. Other foreign investment is in various forms, but it is classified into portfolio investment, derivatives, and “other investment”. Portfolio investment is seeking purely a financial return rather than control of a company, and can include minority shareholdings in a company as well as debt. Derivatives, which are bets or insurance (whichever way you want to look at it) on the future value of an asset, have only relatively recently been recorded in the statistics, but are increasingly important and of increasing concern because they can create risk as well as be a form of insurance against it. Other investment includes trade credit, loans, currency and deposits.
Most of this is non-equity investment. Together, all non-equity investment is what is known as international debt (see Figure 5). The Canterbury earthquakes made an appreciable dent to the tune of $20.2 billion in the net debt as a result of local insurers reinsuring overseas. The claims on these insurers are assets – until they are paid out. Eventually of course they will be spent, some on goods, services and construction materials from overseas, worsening the current account deficit and the international liability situation.
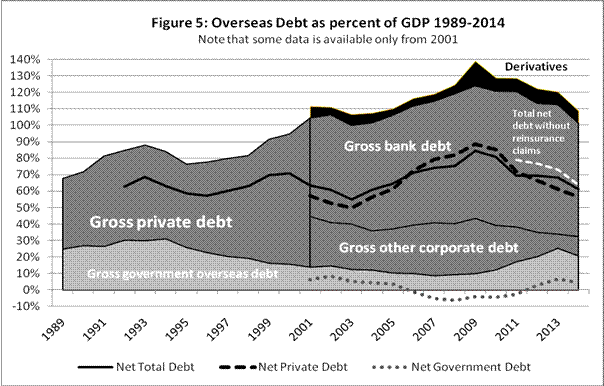
These other forms of investment have their own problems. In particular they can be highly volatile. While FDI is cyclical to a degree, other forms of investment can be much more so, significantly exacerbating booms and busts of economic cycles and financial crises as was seen during the GFC and the Asian Financial Crisis at the turn of the century. Large scale overseas short-term borrowing by banks in New Zealand during the 2000s threatened a liquidity crisis during the GFC which forced the Reserve Bank to put in place lines of funding to underpin the commercial banks’ positions, and the Government felt compelled to respond with guarantees on deposits and wholesale borrowing which subsequently cost all of us several hundred million dollars. International financial movements can also drive the exchange rate well away from values that reflect economic fundamentals and which would allow net international liabilities to stabilise or reduce. The impact on exporters and firms exposed to import competition is long-lasting.
This experience has renewed interest in policies to manage capital flows and exchange rates. It has led to research and debate among a range of economists, the most remarkable being the International Monetary Fund (IMF) which, before the Asian financial crisis, had been moving to ban all controls on the capital account. It is now accepting that such policies form a necessary part of the “tool kit” for managing external economic relationships (e.g. Blanchard, Dell’Ariccia, & Mauro, 2013; Blanchard & Ostry, 2012; Gallagher, 2010; Ghosh, Qureshi, & Sugawara, 2014; Korinek, 2011; Ostry et al., 2010; Ostry, Ghosh, & Chamon, 2012; Reinhart & Rogoff, 2013; Stiglitz & Ocampo, 2008).
In addition, the international concern at the high level of income and wealth inequalities has led to new comparative cross-country studies looking for differences that are associated with higher inequality. Increased financial globalisation and capital account liberalisation have been identified as significant factors in a number of studies including from the International Labour Organisation (ILO) and researchers from the IMF. There are conflicting findings on inward FDI but outward FDI is found to increase inequality, probably as a result of offshoring of production (see, for example, Furceri & Loungani, 2013; International Labour Office, 2013; Jaumotte, Lall, & Papageorgiou, 2013; Organisation for Economic Cooperation and Development, 2011. New Zealand is in the population used for the ILO and OECD studies).
There is also growing suspicion that there can be “too much finance”. In 2012, two groups of researchers in the Bank of International Settlements (BIS) and the IMF (Cecchetti & Kharroubi, 2012; Arcand, Berkes, & Panizza, 2012) came to the conclusion that after a certain point, the size of the financial sector relative to the size of the economy is a drag on economic growth. That work has been further extended in 2015 (Cecchetti & Kharroubi, 2015; Sahay et al., 2015). It comes as little surprise that countries like the US, Iceland, Ireland, the UK, Spain, and Portugal figured high in the list of those well over the critical point, but New Zealand was there too. The 2012 BIS report (p.4) estimated that for New Zealand, the growth in the size of the financial sector since the early 1990s “created a drag of nearly one half of one percentage point on trend productivity growth”. This is a huge drag given annual productivity growth as they measured it (GDP per worker) averaged just 1.1% over the period. The size and stability of the financial sector is difficult to control with open capital markets. The international financing of mortgages by New Zealand banks prior to the Global Financial Crisis is an example in which monetary policy is severely weakened by the availability of international finance (the “impossible trilemma” of the open economy) but also drives its increased use (e.g. Merrouche & Nier, 2010. See also my article “Financial Crises, Trilemmas And A Time to Rethink” in Watchdog 120, May 2009, http://www.converge.org.nz/watchdog/20/02.htm).
Income From Foreign Investment
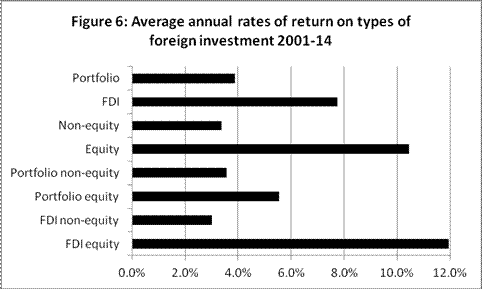
The financial cost to New Zealand of foreign investment is considerable: from FDI alone, it was $9.4 billion in remittance of profits abroad in the 2014 calendar year, out of the $17.1 billion in investment income remitted in total6. If we must have funding from overseas, the cost of foreign equity capital is high compared to foreign debt. Balance of Payments data shows the average return on New Zealand’s international equity liabilities between 2001 and 2014 was 10.4%, three times the average return on debt of 3.4%. FDI received twice the return of portfolio investment – 7.8% compared to 3.9% (and FDI equity got an average return of 12.0%). See Figure 6.
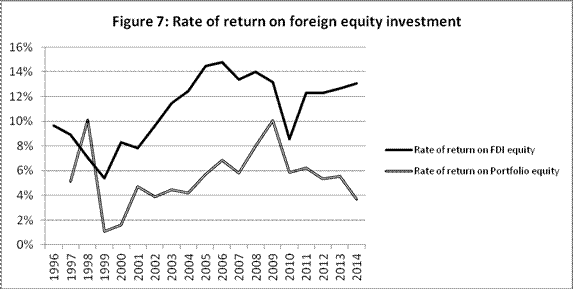
Though we have data only back to 1996, as Figure 7 shows, profit rates on equity rose steeply between the late 1990s and mid-2000s. There was a dip in profit rate in the late 1990s at the time of the recession, and again in the year to March 2010, though the profit rate for portfolio equity investment has continued to fall.
In all, the outflow of income on foreign investment in New Zealand well exceeds New Zealand’s current account deficit as Figure 8 shows, leading to high and growing international liabilities. Even the net deficit on investment income – where the income on New Zealand’s foreign investment abroad is offset against the income from foreign investment here – exceeds the current account deficit. About two-thirds of both the debt and the net deficit in investment income is the responsibility of the banks.
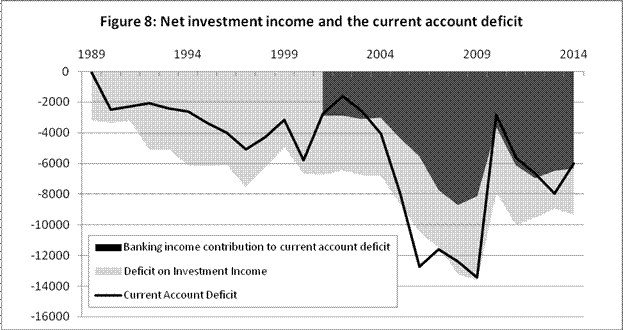
The cost of New Zealand’s international liabilities is the main driver increasing those liabilities. It is more than our total dairy and forestry exports. The income on FDI alone is equal to the proceeds of our milk powder plus seafood exports. International debt peaked in 2009, the fall since then helped by increasing returns to dairy and other commodity exports, lower imports when the economy was in recession, falling interest rates, lower profits of overseas owned companies, and reinsurance claims from the Canterbury earthquakes. Most of these are now reversing, and because there has not been any fundamental change in the New Zealand economy, debt will begin rising again.
What Can Be Done About This?
The standard answer seems to be “we should save more”. But the problem is not so much saving as how savings are invested. If the savings are invested in property and simply push up property prices, then increasing foreign debt and overseas control of our assets will continue. We need to move into higher value production and in particular higher value exports. That means increasing output per hour worked and per dollar invested. It is not about working harder but about the owners of firms investing in better equipment, technology and production processes, and listening to their workers who are the ones who know what is really happening in their workplace. Of course (and that is another story) we also have to make sure that New Zealand workers see wages increasing in proportion to their more productive work, unlike over the last quarter of a century. That is about much better employment legislation and strengthening unions and collective bargaining in order to restore more balance in the bargaining power of workers compared to employers.
But there is a sequencing problem: how to diversify, significantly increase productivity, reduce reliance on property investment, and increase savings in a relatively low-wage economy and in an environment – such as the high value of the dollar, and disabling rules in trade and investment agreements – that discourages those moves? Stronger industry policy is a crucial part of the resolution of the problem, but it will not succeed with a chronically high exchange rate, and is difficult to do when these agreements have taken away our right to use many of the policies needed to succeed. We need to use policies that will enable us to manage the exchange rate while moving to a more balanced economy. We also need them for times of exceptional or potentially destabilising capital flows or unsustainable currency valuations, which our higher indebtedness makes us very susceptible to. And as we have seen, while some FDI may be helpful, much of it is not. We have low quality FDI, and in addition there are widespread sensitivities around the overseas ownership of New Zealand’s land and fishing quota, which should be respected for both economic reasons (including external control of supply chains from paddock to plate) and cultural reasons.
There is, therefore, good reason to be selective of foreign direct investment with much more active filtering, and conditions on the performance of direct investors. Compare it with inward migration: there are strong controls over who may become a permanent resident in New Zealand (with the exception of Australian and New Zealand citizens) and some expectations as to their behaviour once they are here. Even if there is debate as to what criteria and conditions are desirable and necessary for inward investment, it would be reckless to discard our ability to pursue such policies in some form.
Yet the limited remaining policy space we have for controlling financial movements, managing the exchange rate, acting during financial crises and choosing foreign direct investment that is beneficial to New Zealand is now under threat in the latest round of international commerce and investment agreements such as with South Korea and the Trans Pacific Partnership Agreement (TPPA). For example, these limit our ability to choose foreign investments or to control their behaviour through restrictions on Performance Requirements. These restrictions explicitly rule out a list of potential conditions such as requirements to export, use local content, or introduce new technology or processes. They prevent any more favourable treatment being given to local firms. They give overseas investors the ability to enforce these rules and to make other social, economic and environmental progress more difficult, in dysfunctional investor-State dispute processes which increase the privileges of these powerful forces even further. These agreements therefore encourage increased overseas investment but reduce New Zealand’s ability to control and ensure benefit from the investment.
Strengthen Law
New Zealand should strengthen its overseas investment legislation as far as it can, develop measures to strengthen its position with regard to international capital flows, and resist any further international commitments which restrict its ability to put these into practice. It should consider how to withdraw from such restrictive provisions and should seek international agreement and cooperation to enhance the effectiveness of measures aimed at improving the quality of investment including capital flow management and combating tax evasion and avoidance. We should pursue industry policies to move the economy towards higher value production, accompanied by strengthened employment law which ensures that workers share in the higher income from that production and social security policies that ensure they are not the constant victims of the insecurity of the globalised economy.
References
Arcand, J.-L, Berkes, E, & Panizza, U (2012). “Too Much Finance?” (Working Paper No. WP/12/161) (p. 49). Washington DC, USA: International Monetary Fund. Retrieved from https://www.imf.org/external/pubs/cat/longres.cfm?sk=26011.0
Blanchard, O, Dell’Ariccia, G, & Mauro, P (2013). “Rethinking Macro Policy II: Getting Granular” (Staff Discussion Note No. SDN/13/03). Washington DC, USA: International Monetary Fund. Retrieved from http://www.imf.org/external/pubs/cat/longres.aspx?sk=40477.0
Blanchard, O, & Ostry, JD (2012, December 11). “The Multilateral Approach To Capital Controls” Retrieved 13/10/13, from http://www.voxeu.org/article/multilateral-approach-capital-controls
Cecchetti, SG, & Kharroubi, E. (2012). “Reassessing The Impact Of Finance On Growth” (Working Paper No. 381) (p. 22). Bank for International Settlements. Retrieved from http://www.bis.org/publ/work381.htm
Cecchetti, SG, & Kharroubi, E. (2015). “Why Does Financial Sector Growth Crowd Out Real Economic Growth?” (Working Paper No. 490). Bank for International Settlements. Retrieved from http://www.bis.org/publ/work490.htm
Doan, TT, Iyer, KG, & Maré, DC (2014). “Productivity Spillovers From Foreign Direct Investment In New Zealand”. Wellington, New Zealand: Ministry of Business Innovation & Employment. Retrieved from http://www.mbie.govt.nz/about-us/publications/occasional-papers/2014-occasional-papers/14-01.pdf/at_download/file
Fabling, R, & Sanderson, L (2011). “Foreign Acquisition And The Performance Of New Zealand Firms” (Working Paper No. WP 11/06) (p. (2),ii,23). Wellington, New Zealand: The Treasury. Retrieved from http://purl.oclc.org/nzt/p-1425
Foreign Direct Investment Advisory Group. (1997). “Inbound Investment: Facts And Figures”. New Zealand: New Zealand Government.
Furceri, D, & Loungani, P (2013). “Who Let The Gini Out? Capital Account Liberalisation And Fiscal Consolidation Confer Benefits But Also Lead To Increased Inequality”. Finance & Development, 50(4), 25–27. Retrieved from https://www.imf.org/external/pubs/ft/fandd/2013/12/index.htm
Gallagher, KP (2010). “Policy Space To Prevent And Mitigate Financial Crises In Trade And Investment Agreements” (Discussion Paper No. 58) (p. 34). United Nations Conference on Trade and Development. Retrieved from http://www.unctad.org/en/docs/gdsmdpg2420101_en.pdf
Ghosh, AR, Qureshi, MS, & Sugawara, N (2014). “Regulating Capital Flows At Both Ends: Does It Work?” (Working Paper No. WP14/188). Washington DC, USA: International Monetary Fund. Retrieved from http://www.imf.org/external/pubs/cat/longres.aspx?sk=42400.0
Harris, P, Turner, J, & Werry, D (2011). “A Tale Of Two Networks: Water And Electricity In The Wellington Region 1990 To 2010”. Retrieved from http://www.scoop.co.nz/stories/HL1111/S00231/water-and-electricity-in-the-wellington-region-1990-to-2010.htm
International Labour Office. (2013). Global Wage Report 2012/13: “Wages And Equitable Growth”. Geneva, Switzerland: International Labour Organization. Retrieved from http://www.ilo.org/global/research/global-reports/global-wage-report/2012/WCMS_194843/lang--en/index.htm
Jaumotte, F, Lall, S, & Papageorgiou, C (2013). “Rising Income Inequality: Technology, Or Trade And Financial Globalisation?” IMF Economic Review, 61(2), 271–309. http://doi.org/10.1057/imfer.2013.7
Korinek, A (2011). “The New Economics Of Capital Controls Imposed For Prudential Reasons” (Working Paper No. 11/298) (p. 37). Washington DC, USA: International Monetary Fund. Retrieved from http://www.imf.org/external/pubs/cat/longres.aspx?sk=25449.0
Merrouche, O, & Nier, E (2010). “What Caused The Global Financial Crisis - Evidence On The Drivers Of Financial Imbalances 1999 – 2007” (Working Paper No. 10/265). IMF. Retrieved from http://www.imf.org/external/pubs/cat/longres.cfm?sk=24370.0
Organisation for Economic Co-operation and Development. (2011). “Divided We Stand: Why Inequality Keeps Rising”. Paris: OECD. Retrieved from http://dx.doi.org/10.1787/9789264119536-en
Ostry, JD, Ghosh, AR, & Chamon, M (2012). “Two Targets, Two Instruments: Monetary and Exchange Rate Policies In Emerging Market Economies” (Discussion Paper No. 12/01) (p. 25 + Appendix of 9 pages). Washington DC, USA: International Monetary Fund. Retrieved from https://www.imf.org/external/pubs/cat/longres.aspx?sk=25732.0
Ostry, JD, Ghosh, AR, Habermeier, K, Chamon, M, Qureshi, MS, & Reinhardt, DBS (2010). “Capital Inflows: The Role Of Controls” (No. SPN/10/04) (p. 29). International Monetary Fund. Retrieved from www.imf.org/external/pubs/ft/spn/2010/spn1004.pdf
Reinhart, CM, & Rogoff, K (2013). “Financial And Sovereign Debt Crises: Some Lessons Learned And Those Forgotten” (Working Paper No. WP 13/266). Washington DC, USA: International Monetary Fund. Retrieved from https://www.imf.org/external/pubs/cat/longres.aspx?sk=41173
Rosenberg, B (1997). “Foreign Investment In New Zealand: The Current Position”. In “Foreign Investment: The New Zealand Experience” (pp. 23–66). Palmerston North, N.Z: Dunmore Press.
Sahay, R, Čihák, M, N’Diaye, P, Barajas, A, Bi, R, Ayala, D, Yousefi, SR (2015). “Rethinking Financial Deepening: Stability And Growth in Emerging Markets” (Staff Discussion Note No. SDN/15/08). Washington DC, USA: International Monetary Fund. Retrieved from http://www.imf.org/external/pubs/cat/longres.aspx?sk=42868.0
Stiglitz, J, & Ocampo, JA (2008). “Capital Market Liberalisation And Development”. Oxford; New York: Oxford University Press.
Endnotes
- “Overseas Ownership Of Land Far Greater Than The 1% The PM Claims”, Watchdog 129, April 2012, http://www.converge.org.nz/watchdog/29/02.htm.
- This is assuming the change in survey methodology and definition of FDI does not contribute to the difference in the make-up of increased FDI between the two periods. Note that the proportions given in the following paragraphs do not take account of inflation over the period, but taking account of it in fact makes little difference.
- It includes New Zealand companies borrowing from their offshore subsidiaries. The preferred measure of “international investment position” is on a “balance sheet basis”. In this, all investment from overseas is counted as a liability against New Zealand’s balance sheet, including from New Zealand owned companies resident in another country – typically, lending money to their parent. Statistics New Zealand also gives an alternative “directional” basis which accounts for the investment on the basis of domicile of ownership. In net terms, both give the same result. Not all statistics are available on the directional basis, but for those available, the picture does not look much different. For example, on a directional basis revaluations accounted for 30% of the increase in FDI since 2001 and reinvested profits 65% and 32% of the income was reinvested.
- JBWere data began in 1997. Earlier data comes mainly from a survey of overseas ownership of the shares of the NZSE Top 40 by Doyle Paterson Brown Ltd. For exact sources see http://canterbury.cyberplace.org.nz/community/CAFCA/key-facts.html.
- Statistics New Zealand describes this data as being “non-official”, and warns that sector estimates are based on current available data sources; it uses the Annual Enterprise Survey and uses specific line-codes which are not normally released at this level; the non-household sector equity estimates have not been fully analysed and they therefore expect some revisions when this is completed; and further work using extended savings data from the Household Economic Survey on Household Net Worth due to be released in 2016 may result in revisions.
- Statistics New Zealand, Balance of Payments, year ended December 2014.
Non-Members:It takes a lot
of work to compile and write the material presented on these pages - if
you value the information, please send a donation to the address below to
help us continue the work.
Foreign Control Watchdog, P O Box 2258, Christchurch, New Zealand/Aotearoa.
Email

