INEQUALITY AND EXCESS PROFITS IN NEW ZEALAND
by Bill Rosenberg & Geoff Bertram
- Greg Waite
This article summarises a presentation by Bill and Geoff to the Fabian Society in August 2021, which you can view online here. It's a bit technical, but the new evidence they produce is extremely interesting. A summary of Geoff's May 2021 article in the Policy Quarterly journal follows, providing more background and by far the best demolition of New Zealand's free market economic policies I've ever read.
Part One: The National Accounts
Bill and Geoff's presentation is an analysis of New Zealand's national accounts. Geoff started by outlining the two competing economic theories about how shares of the national product are distributed to capital, labour and land - neo-liberal/free markets vs. neo-Ricardian/neo-Marxist; according to their marginal product in competitive markets vs. balance of power and class struggle. The neo-Marxist perspective also attributes a critical role to the degree of monopoly in the balance of power between capital and labour.
Geoff points out that if the former perspective were accurate, you'd expect to see a relatively gently adjusting market equilibrium, whereas the latter would produce a bumpier chart when institutional changes like the 1991 Employment Contracts Act (ECA) undermine labour's bargaining power. The first part of their presentation focuses on this question: do the shares to labour and capital change smoothly over time or not?
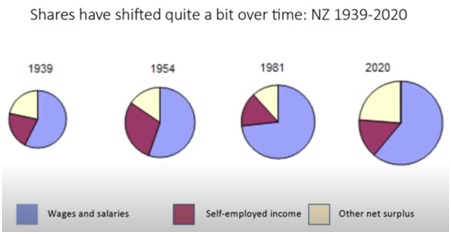
In the chart above, you can see the gains to labour by 1981, then the resurgence of capital by 2020 clearly. Note that the self-employed include a mix of employees (on individual contracts, not wages) and capitalists (in small businesses). Next, Geoff showed annual data, where he found 1991 (the ECA) was not the largest change point in the chart, suggesting there are also other critical factors. Muldoon's wage freeze after the oil price rises was one. Another key turning point in 1991/92 was deregulation, which allowed "rentier capitalism" i.e., excess surpluses above competitive market levels.
From here, Bill tested and added a series of refinements to measure the trend in labour and capital shares more accurately. First, he showed how the employment rate chart mirrored the labour share chart, which is natural as more people are drawn into work by higher wages. The point here is that an increasing share of the total social product to labour can't be thought of simply as higher wages, since the gains were distributed across an increased workforce. Part of this was higher immigration, part was the self-employed moving to safer waged work, part the movement of Maori to urban labour markets.
So, the measure was adjusted to show the ratio of compensation per employee over national income per adult. This is the original labour share ratio divided by the employment rate, i.e., removing the influence of changes in work participation to follow just the ratio of wage compensation to total per capita income. This shows a much flatter and more consistent ratio right from the 1940s to the 1980s, a jump in the 1980s, then a consistent fall after the ECA.
Then, adding another step to get closer to the real-life experience of average per-worker compensation, wages were divided across the entire workforce including the very high number of unemployed in 1990 which followed the oil price shock, inflation and Rogernomics. Now, most of the peak before 1990 disappears.
This is a sobering picture from the perspective of labour history, since old unionists tend to look back on earlier years and militant unions with rose tinted glasses - a series of battles and wins, followed by political and economic reversals. What if much of those gains for labour were merely a transfer from the unemployed to higher wages for the strongest unions? Perhaps union strategy should have had greater emphasis on national campaigns which supported our less-militant sectors so all shared in the gains?
Next, Bill presented a chart of the total social product 1940-2020. Here we saw the Rogernomics policy-driven recession shrinking the total social pie. Again, this has implications for how we interpret the labour-share ratio. Gains from the 1980s were mostly driven by a shrinking denominator - the total social pie - not the mythic gains to militant labour. More sobering food for thought! None of this is to say there were no gains from militant wage bargaining. What it is saying is that the gains were not that large.
Finally, Bill contrasted corporate profits per adult and real wages per adult, and here we could see a massive social change - in the share to profits. Profits grew 120% from 1991-2020, compared to 20% growth in the labour share.
Part Two: Rentier Capitalism
Geoff then returned to look more closely at those increased profits, and what the national accounts can tell us about the growth of rentier capitalism - the exercise of monopoly power to extract excess profits. He introduced this by pointing to the net surplus after 1991/92 increasing much faster than the cost of capital. This implies a movement away from competitive markets after deregulation, with a higher share of productive income distributed to shareholders (and senior executives). Another simple way to measure monopoly is markup on costs. Private sector mark-up also rose dramatically, from under 30% in the 1970s to 38% in 2018.
So, competitive markets are "missing in action" - but without them, incomes cannot be attributed only to the marginal product of the factors. Part of the social product is going somewhere else. One standard approach used by regulators facing monopolies is to estimate a "warranted return on capital" which would compensate for their investment, with the excess referred to as "pure profits" (i.e., unrelated to productive investment). There has been some recent American research which showed the labour and capital shares declining between 1984 and 2014, while the "pure profit" share rose.
Following this approach, Geoff presented a chart of New Zealand's "warranted rate of return" from 1939 to 2019. We saw an enormous jump during World War Two from the long-term average of around 15% to 45% (and corporate tax was 89% then!), dips in 1951-52 and again in 1969-75 (during a time of high capital gains due to high inflation, which kick-started Brierley's corporate raiding spree), a steady rise from 1975 to 1986 (29%), then a downward trend to reach 11% in 2019 (falling interest rates lowering cost of capital). Multiplying this rate of return by the cost of capital allows us to see the warranted return (share) to capital over time. This is contrasted with the total surplus paid to capital in the chart below.
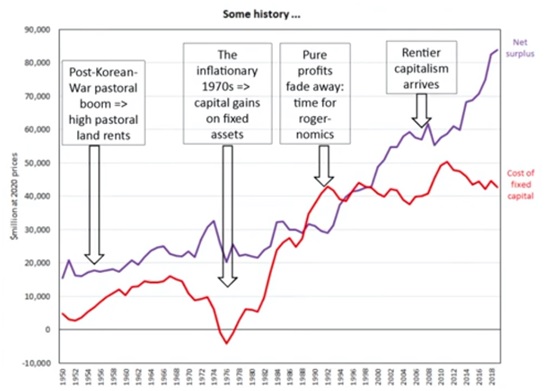
After Rogernomics, the warranted return on capital flattens off and the additional surplus - the difference between the two lines, "pure profits" (excess/unearned profits), rentier or extractive capitalism - just keeps on growing to reach $40 billion in 2018, or $18,000 per worker per year.
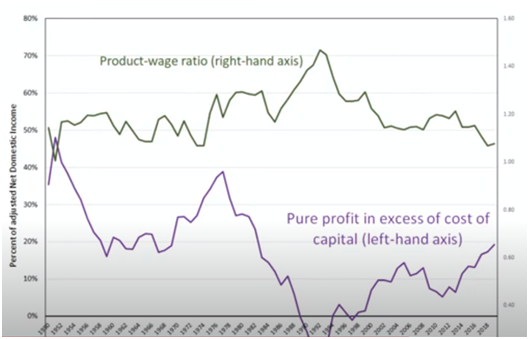
Finally, contrasting the labour share of production and the "pure profit" over time in the chart above, they are mirror images after Rogernomics/1991 - those excess profits came directly from labour. In question time, they acknowledged that further work on where that excess surplus goes would be valuable - which sectors got the most (electricity?), and how much heads overseas, for example.
"Regulatory Capture In Product Markets And The Power Of Business Interests" Geoff Bertram, Policy Quarterly, May 2021. Geoff doesn't mince words here. To quote the abstract: "This article explains pervasive regulatory failure, lagging productivity, and the corporate capture of policy and policymakers as ...outcomes of the New Zealand Treasury's radical adoption during the 1980s of public choice and Chicago School doctrines".
"With deregulation and a limited role of Government written into statutes and embodied in regulatory practice ... privatisation opened the way for looting; the Commerce Act and new regulatory guidelines enabled rather than blocked anti-competitive practices and monopolistic rent-taking; relaxed oversight meant that foreign direct investment became more extractive and less productive".
I won't give a full summary here, because this article is so well written that you'll get more from reading the original, which is freely available online. I did want to highlight one point though, that after privatisation "and the first generation of predators have taken their ill-gotten gains and moved on, their successors will be left holding assets for which they have paid the capitalised value of the rents gained by capture or predation. The result is that predation is locked in and difficult to reverse, because of losses that would have to be borne by the successor group, who bear no responsibility for the capture but have committed their wealth to the post-capture industry".
This description also applies perfectly to today's over-priced housing market. Investors have piled in to get their tax-free capital gains, but since no owner wants to take a loss, few properties will be offered when there's downward pressure on prices, which locks in our over-priced housing. But as capital gains end when price growth flattens off, all the investors' costs now have to be covered from the pockets of tenants. The dramatic rent increases we saw in the last year (10%) are likely to continue - we have locked in these excess rents. This is a reminder that seriously bad policy - like no capital gains tax - must change.
Not Foreign "Investment", But Takeovers For Profit Extraction
Returning to Geoff's article, three more quotes are included below for their relevance to Watchdog: "A striking feature of the New Zealand privatisations of 1987-96 was precisely the domination of value extraction over value creation (on these concepts see Lazonick and O'Sullivan, 2000). Typically, the private 'insider' purchasers used leveraged buy-out tactics to secure control, then extracted cash gains and exited, in several cases leaving the enterprises they had sold in a parlous state requiring taxpayer-funded bail-outs".
"The inroads of foreign investors into New Zealand markets under deregulation went far beyond participation in that early rush to buy up privatised State assets. Controls on foreign investment were loosened substantially from the late 1980s on, resulting in a switch away from the previous tendency for foreign direct investment to be directed to financing new productive ventures, towards takeovers of existing operations from which profits could be extracted by exploiting New Zealand's very lax regulatory and tax arrangements".
"Turning to the 'benefit to New Zealand' test, any impression from the name of the test that it involves a weighing-up of costs and benefits would be quite wrong. The 'test', applied to overseas purchases of 'sensitive land', requires only the counting of benefits and rules out most consideration of costs". There are many more insights in Geoff's article: recommended reading and available free online.
Non-Members:It takes a lot
of work to compile and write the material presented on these pages - if
you value the information, please send a donation to the address below to
help us continue the work.
Foreign Control Watchdog, P O Box 2258, Christchurch, New Zealand/Aotearoa.
Email