POVERTY UPDATE
Election Promises Vs Real Life
- Greg Waite
This issue's Poverty Update includes some new research on rental (un)affordability and trends in the supply of affordable rental stock. To start though, I'll recap on changes in the global economy over the last 40 years which provide context and explanation for our poor rental affordability.
- The neoliberal prescription for less Government, less corporate regulation, private not public services, debt-funded education, wealthy technical elites but weakened unions and more casualised work, longer hours and later retirements;
- State subsidies for business via lower interest rates and lending costs, boosting returns for mobile capital but increasing our living costs and reducing our savings through inflation;
- The decline of monopoly regulation, leading to the rise of monopsony with its excess profits and prices;
- Globally coordinated State support so private corporations avoid the consequences of each new economic crisis they cause, and transfer the costs to citizens;
- Large global investors moving into infrastructure and housing funds, restructuring these essential assets to extract fees and profits which then imposes costs on future tenants and citizens (see review of "Our Assets In Their Portfolios", this issue);
- High levels of First World population growth through inward migration, boosting businesses and holding down wages;
- Social media evading regulation and taxes, covertly monitoring your life for profit while aiding elite promotion of conservative and authoritarian misinformation;
- Shifting the political focus to leadership not representation, messaging not policy, media management not debate, benefiting economic and racial elites not increasing equity and stability, money dominating campaigning, citizens as critics not political participants;
I recap all these global changes because they shape the working world we now live in: beginning work with student debt, constrained wages for most, less security, longer working hours, weak unions, shrinking State services, rising living costs. And on top of all that we add our uniquely New Zealand twist on making life harder. We have the most expensive housing in the world, thanks to 40 years without capital gains tax encouraging overinvestment in old housing when we needed to build more new homes.
Today, the housing policies of National are very clearly aligned with these global and national trends. The removal of Labour's recent tenant protections, the return of interest deductibility and the reduction of the Brightline test to two years on existing houses will encourage another round of speculative overinvestment in old homes.
To gain political control and make those easy profits National has committed to many Centre-Left policies it clearly doesn't believe in; building State housing, increasing benefits in line with inflation, monitoring poverty trends. Whether National has decided this minimal safety net is a manageable cost to secure election for a pro-business Government or just short-term expediency remains to be seen.
ACT is more aggressively pro-rich, seeking to remove the Reserve Bank guidance to balance inflation and unemployment. ACT's preference is to quickly push down wages through increasing unemployment, ensuring wealth is protected from inflation and the cost of the adjustment falls on the most vulnerable.
The Long Road Downhill
Sadly, there is little public understanding that worse will follow. National's tax subsidies for landlords will take the pressure off rents for a short while because landlords will get capital gains, but only by increasing already unaffordable house prices further. When the next boom ends and prices top out, landlords' returns have to come from rents, not capital gains. Imagine the rent required to get a comparable return on the new average $1.2 million house when you can get 8% or more on the share market. Somewhere north of $1000 a week.
Meanwhile, home ownership rates will continue to fall because homes cost more. More people will be renting, and renting for life including retirement. That means poorer for life, with nothing to fall back on when things go wrong. Imagine renting privately on the old age pension, currently $496 net a week for singles.
1. Measuring Rental Affordability Today
I completed three research papers in August 2023 which take a new look at private renters in Aotearoa. A second paper then reviews changes in our supply of affordable rental homes over the last five years and a third paper explores how our complex benefit system contributes to unaffordability (Child Poverty Action Group).
When you read most research on affordability you see rule-of-thumb approaches where rents less than 30% of income are affordable. In these papers I used the recommendations of our own Welfare Expert Advisory Group (2019, adjusted for inflation since) on how much income different households needed after rent to afford a basic standard of living. By using administrative data (income, tax, benefits, rent) I was able to provide a much more accurate measure of affordability.
Among the results, 63% of couples with children earning the minimum wage and working 60 hours a week could not afford their rental housing. This single figure highlights what is out of balance in today's economy - people on low wages cannot have a balanced life because the rent must be paid, so either more hours must be worked or other essentials are foregone.
In June 2021, singles and couples receiving the Jobseeker benefit faced the largest shortfall in weekly income ($157, 37% and $240, 36% respectively), closely followed by couples with children ($323 per week, 33% of weekly income). Unusually, benefits were increased by more than inflation in 2021-22, but still needed to rise by between $134 and $272 a week (depending on family size) to meet the Welfare Expert Advisory Group's (WEAG) basic standard of living.
If that seems too high, keep in mind the WEAG set these levels to provide a basic but realistic minimum living standard. They are closer to the age pension than current benefits and include maintaining a second-hand car to get to work and, for example, $10 presents for immediate family twice a year. The largest new pressures on rental affordability from 2018 to 2023 were from rising rents (up $90 and 19%), food ($62, 23%) and transport ($21, 26%). Looking at longer term changes, the average annual rent rise was 11.2%, 2.7%, 2.7% and 3.3% over the four decades to 2022. More recently, annual rent increases have risen to around 4% since 2021.
2. Trends In Affordable Rental Supply
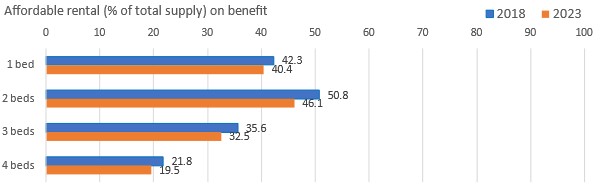
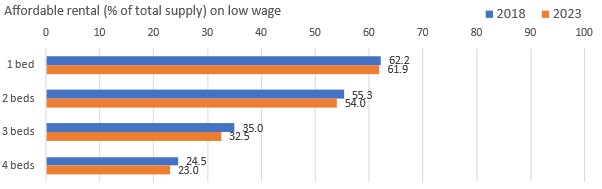
In the second paper, benchmarks for affordably priced rental were calculated at three income levels; median incomes, low wages, and benefit incomes. These "affordable rents" were rents which the typical households living in each size home could afford on each income level. My aim in this paper was to isolate and understand the contribution of changes in rental supply to affordability - changes in the total number of properties for rent, but also in the share which are affordable. Rents can change for many reasons - redevelopment replacing affordable old homes with unaffordable new ones for example.
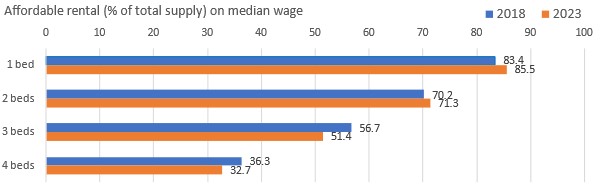
Looking at trends by dwelling size for households reliant on benefits and low incomes, the proportion of affordable rental homes fell by between 0.3% and 4.7% between 2018 and 2023. In contrast, the proportion of rental stock which is affordable on median incomes rose by 2.1% and 1.1% for one and two bedrooms, but fell by 5.3% and 3.6% for three and four-bedroom dwellings (Chart 1). And while the affordable housing supply was mostly shrinking, population growth over the same period was 8%.
Chart 1. Change In Affordable Private Rental Stock (% Of Total Stock) By Income And Beds, 2018-23
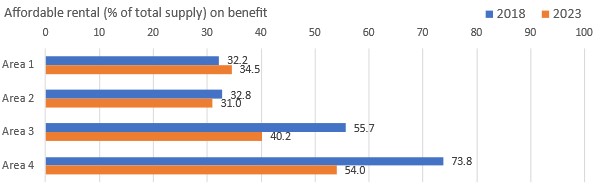
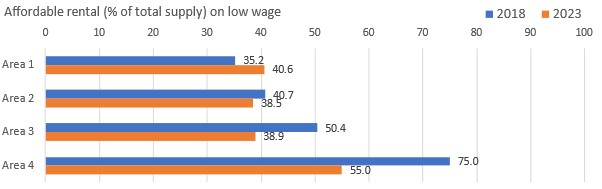
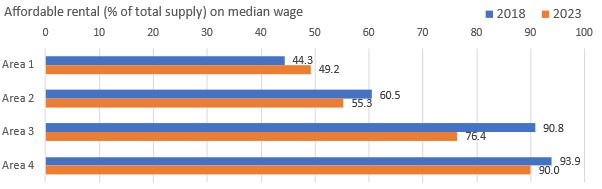
Looking at trends across areas of higher to lower rents (Chart 2), the supply of affordable rental has increased only in our most expensive suburbs (Area 1) across all three income benchmarks (up between 2.3% and 5.4%). Supply has contracted in the other three areas covering lower-rent suburbs, with dramatic declines in the two lowest rent areas and the two lower-income benchmarks (down 11.5% to 20%).
Only Area 1, the suburbs with highest rents, provided enough new affordable stock to match the pace of population growth, which was 8% over last five years. In total, the national stock of private rental homes grew by 6%, but the total affordable stock at or below the benefit, low income and median income benchmarks changed by -3.5%, 1.4% and 1.6% respectively.
Chart 2. Change In Affordable Private Rental Stock (% Of Total Stock) By Income And Area, 2018-23
So, to sum up:
- The number of people who need homes is growing much faster than the rental supply,
- the share of rentals which is affordable is shrinking in most areas,
- only in more expensive areas for one-bedroom flats does supply comes close to meeting demand,
- these declines in affordable supply over the last five years disproportionately impact households on the lowest incomes and in areas with lower rents.
Systemic Flaws In Social Support Systems
Our income support system, which tops up income for people on both benefits and low incomes, is complex and as a result, poorly understood. Unfortunately, that complexity allows conservative Governments to quietly undermine payment levels by increasing main benefits but leaving secondary payments and tax credits unchanged. For example, the critical accommodation supplement, which tops up low incomes when your rent is too high, was not adjusted for inflation during the entire term of the previous National government from 2008-2017.
A Brief Summary Of The Main Problems
- Accommodation Supplement design and effectiveness
In March 2023 343,572 persons relied on accommodation supplement payments. Thresholds for payments – the starting and maximum rents – are adjusted only when the Government chooses. When they are unadjusted for rent inflation, payments fall over time. The accommodation supplement also has a very low cash and investments asset test, with payments decreasing above $2,700 and fully abated at $8,100 per person, a threshold which has not been adjusted since 1988. This is particularly harsh for renting retirees, who need sufficient savings to supplement a fixed income throughout their retirement. - Working For Families tax credits
Working For Families currently supports just under 350,000 families with children through a complex set of four payments. That complexity means more households miss out, and the income abatement threshold and rates for Family Tax Credit create a very high marginal tax rate when returning to employment. - Inflation indexation required
After 1 April 2020, annual benefit increases were aligned with NZ Super and tied to annual movements in average wages. This was an essential first step towards creating a sustainable benefit system. Reliance on occasional one-off increases had meant equity declined between decisions, leaving the most vulnerable worse off under conservative Governments.That change only gets us halfway though. Automatic indexation of secondary payments is also needed so they keep up with main benefit updates. Indexation is not currently applied to either the Accommodation Supplement thresholds or Working For Families (WFF), so Treasury's 2023 budget showed declining real payments in their forecasts to 2027. Indexation is similarly essential for income limits and abatement thresholds (and beyond benefits, annual indexation of tax rate thresholds is similarly logical, insulating wages from the political cycle so income for low-wage workers is more consistent).
- High marginal tax rates disincentivise employment
Low thresholds for reduced benefits, plus payments which are not available to those on part benefits, combine to produce very high effective marginal tax rates during returns to work or when income is variable. The Child Poverty Action Group has recommended decreasing the WFF abatement rate to 20% to lower the effective marginal tax rates on low income working families and improve the returns from work, and increasing the threshold for abatement of benefits to ten hours at the minimum wage. An even higher abatement threshold for a fixed period at the start of returns to work would also incentivise and ease the transition.The Welfare Expert Advisory Group recommended "replacing the current work incentive tax credits with a new tax credit targeted at those on a benefit entering into paid work, including part-time work. Alongside an increase in various abatement thresholds, this will maintain the incentive to work that might otherwise be affected by increases in main benefit rates".
- Systemic clawbacks which reduce publicly announced benefit increases
Increases to benefits produce an offsetting reduction in the Accommodation Supplement. The starting rent for this 70% subsidy is pegged to 25% of main benefits and rises with each benefit increase, but the maximum rent is rarely adjusted. Together, this reduces the real value of payments over time. And for the minority who receive Temporary Additional Support (TAS), increases in a main benefit or secondary payment can result in a reduced calculation of TAS entitlement. - Systemic complexity and missed entitlements
Past reports from the Welfare Expert Advisory Group and the Child Poverty Action Group have documented inequity and inconsistency in our social support system, and my own research highlighted areas where payment coverage was low due to systemic complexity. Over the longer term, the Welfare Expert Advisory Group's Whakamana Tāngata report also proposed a very different trust-based social support system where personalised solutions focused on long-term outcomes. The failure of punitive approaches in the current system is clearly shown by the $2.4 billion debt recorded today to the Ministry of Social Development by our poorest citizens.
Searching For Solutions
There is a growing gulf between elite self-interest and the fragile lives of low wage families, globally and locally. We need to search for new solutions which improve our world, not continue policies which make life today harder and life for future generations harder still. I've worked in housing for over 20 years now, watching the retreat from policies which could provide more new and genuinely affordable housing.
Today, New Zealanders are literally at rock bottom in the Organisation for Economic Cooperation and Development's rental affordability rankings for 42 countries - and our population is still growing faster than our supply of affordable rental homes. Without big changes, future generations will be much worse off as unaffordable renting replaces affordable home ownership for more young families and more retirees.
Locally, I hear a rising call for more emergency housing, which reminds me of Australia where night-only emergency housing receives significant funding. This is driven by desperation because our rental supply is failing, but will not solve the homelessness we have created with our excessive housing costs. Research has clearly shown that providing real homes with support is the most effective, and the most cost-effective, solution to homelessness. How to build support for policies which make a real difference is the question we all have to ask.
Non-Members:It takes a lot
of work to compile and write the material presented on these pages - if
you value the information, please send a donation to the address below to
help us continue the work.
Foreign Control Watchdog, P O Box 2258, Christchurch, New Zealand/Aotearoa.
Email