TRENDS AND FUTURE OF NZ RENTAL
Watchdog no. 172 (August 2026)
I’ve been looking closely at rental affordability in New Zealand for the last four years; the results are pretty discouraging. Not only is renting in New Zealand now a disaster,1 I can only see it getting worse in the future. Here, I’m summarising the findings from the first two of six research papers planned in 2026, and I’ll share more in the next issue.
As you’ve probably noticed, today most housing “research” you read is just the perspective of investors—“house prices are up, consumers are confident, more spending will increase growth in the economy”, that sort of thing. Here, I take a more careful look at rental affordability, using the most complete data on incomes and rents available, and checking if households have enough money coming in to meet basic living costs.2
Too often we read or hear simplistic discussions of employment which assume entry to the workforce is sufficient to provide for a good life. In this era of rising inequality and downward pressure on wages, conditions and Government assistance, many are paid low wages and offered less hours than they’d like, living without job security or stable income. Statistics NZ’s Household Labour Force Survey confirms a total of 150,700 part time employees who want to and are available to work more hours (December 2025) but have been unable to secure employment with longer hours (“underutilisation”). Both underutilisation and unemployment have been rising consistently since 2023.
Table 1 below compares private rental affordability for low-income adult households. Since household composition can be complex, ranging from single persons to sharers and complex blended families across generations, households are grouped on their average income per adult to compare how different levels of income, Government support and employment affect private renters. Columns 3 and 4 are the underemployed: households earning less than the full-time minimum wage per adult.
The results show that many working households in private rental do not earn enough to afford the basics of life. Over 70,000 working households earn less than the full-time minimum wage per adult (columns 3 and 4 combined) because they work less than full time, and the majority of these do not receive a benefit (column 4). Working households who get no benefit have by far the largest number of tenancies in unaffordable rental (30,021, column 4). Two thirds of this low-income group (66%) cannot afford their rent and basic living costs.
Table 1. Affordability In Private Rental By Income Source (Low-Income Groups), June 2023
| Low Income Groups: | 1. Full adult rate benefit (no work) |
2.NZ Super | 3.Earnings plus part benefit <min wage |
4.Earnings (no benefit) <min wage |
5.Earnings+ other payments >min wage |
6.Between Minimum & Living Wage |
|---|---|---|---|---|---|---|
| Households | 20,328 | 17,634 | 24,786 | 45,438 | 47,793 | 32,103 |
| Affordable | 2,529 | 4,662 | 12,678 | 15,417 | 37,518 | 27,291 |
| Unaffordable | 17,799 | 12,972 | 12,108 | 30,021 | 10,275 | 4,812 |
| Affordable % | 12% | 26% | 51% | 34% | 79% | 85% |
| Unaffordable | 88% | 74% | 49% | 66% | 21% | 15% |
Notes: Comparison of overall affordability by average weekly earnings per adult.
Table 1 also shows that for those who rent privately and receive full adult-rate benefits while out of work, only 12% of over 20,000 households in private rental receive enough income to cover their rent and the living costs for a basic standard of living.
New Zealand along with the rest of the world has faced first covid supply disruption and price inflation, now followed by war-induced supply disruption and price inflation. I looked at change in each component of household budgets between 2023 and 2026. The largest increase is from renting ($50), followed by food ($34) and transport ($22)—in total, another $164 more to find in just three years—and we have yet to see the full impact of this latest round of living costs inflation or when it may end. Similarly, we do not know the future trajectory of rents. Annual increases have been above 3% every year since 2013, then jumped to 3.7%, 3.9% and 4.6% post-covid (the years to 2022-2024) before falling to 0.7% in the year to March 2026 as the economy slowed.
Next, I looked at changes in New Zealand’s rental housing stock—how the share of affordable properties has changed over time and across different regions—to tell us more about the supply side of housing. Affordability for households is the combined result of many inputs: wage rates, benefits and allowances, taxes, underemployment and unemployment all affect incomes; and on the supply side changes in the quantity, quality and cost of private and social housing, as well as demand modifiers like regional and net migration, all impact affordability.
Changes to income are relatively easy to track, but there is also a lot happening on the supply side which is just as important to understand. Older and cheaper homes are being demolished and redeveloped; new homes are built, some are smaller and more affordable, but many aren’t; while shortages or excesses of supply and population demand, new regulations and interest rate changes, all flow through to rents.
To capture the net effect of all those factors affecting our housing supply, I identified a set of benchmark rents which are broadly affordable at three levels of household income: benefits, low wages, and median-high wages. By comparing the share of the total rental housing stock which is below these benchmarks (i.e. affordable) over time, we can measure if our affordable rental supply is growing or shrinking.
The benchmark affordable rents were identified in 2023, then adjusted each year for changing household incomes. If the share of affordable rental stayed constant it would show that our combination of policies and rental investment was delivering changes in rent consistent with changes in household incomes. They are not. There are large declines in the share of our national private rental stock that was affordable from 2015-2020 and again from 2020-2024 at all three levels of affordable rent benchmarks (coverage is temporarily limited to the year 2024 due to system changes for managing Residential Tenancies bond data).
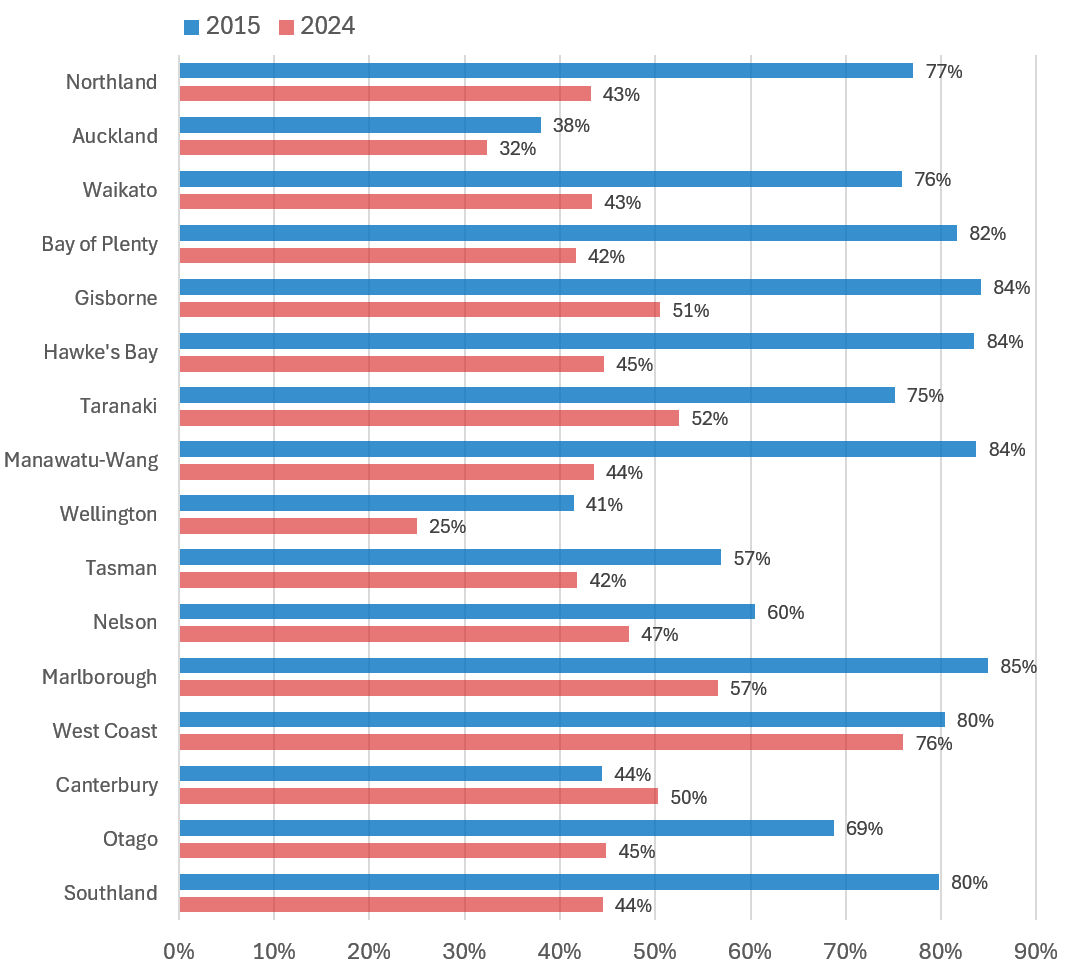
The chart below compares changes from 2015 to 2024 across all New Zealand’s regions. For readability, only the critical low-income affordable rents benchmark is shown. As we saw in Table 1, the largest group of households in poverty come from low-income working households. The sharpest drops in affordable rental supply were in rural regions: Bay of Plenty and Manawatu-Wanganui (-0%; from 84% to 44%), Hawke’s Bay (-39%), Southland (-35%), Northland and Gisborne (-34%), Waikato (-33%).
Because these regions have smaller populations, these very large declines have less impact on the average national change shown in Chart 1, but they have big impacts on local renters. Declines in affordable rental were lower in most larger regions: Auckland (-6%), Wellington (-16%) and Nelson (-13%). House prices in these large urban centres had risen so high that rents could no longer increase in line with capital costs. Too many renters didn’t have the income to pay.
The story of property in New Zealand since the 1980s is one of overinvestment. Investors profited from capital gains; banks profited from the sure bet that overinvestment drove up capital values so their lending was safe. Reinvestment in improving rental properties was low; leveraged acquisition of more properties was the norm. Property investors gain; renters and new home purchasers lose. Eventually, house prices in the big cities reached a peak, limited by purchaser incomes. Investors then switched their overinvestment into the smaller regions, and this large injection of new buyers created larger increases in regional house prices and rents between 2015 and 2024.
Post-earthquake Canterbury is the only exception, with the supply of affordable rental increasing 6% from 2015-2024. Earthquake destruction and population loss made land available cheaply, followed by large scale investment in building small affordable rental properties as the city returned to normal. Zoning reforms have also been implemented at the start of this period, notably in Auckland and Lower Hutt.
Market-oriented research credits these changes with generating a construction boom which resulted in relatively low rent increases in both regions3. Finally, employment and consumer confidence has fallen in Wellington since 2023 due to ongoing Government spending cuts, and the resulting fall in capital city rents is clearly visible in Statistics NZ’s regional rental price index.4
Despite current policies creating an increasingly unaffordable rental supply, the public debate in New Zealand has a narrow focus on market solutions. The spokespeople for investors—bank economists and funded lobbyists—dominate public debate and continue promoting markets as the most efficient way to allocate investment and create growth. But markets are the result of our policy mix; many types of property market are possible. New Zealand’s is demonstrably one of the worst, because we have comparatively unaffordable homes.
Sometimes we hear this described as “market failure”. New Zealand’s property market is more accurately described as a success, but a success only for investors at the cost of renters and recent purchasers. And where once central and local Governments would have worked together as advocates for developer contributions to build more affordable housing and other approaches to reducing inequality, increasingly Government budgets and capacity are being cut to fund tax transfers to the wealthy.
And the 2026 Budget transferred help from the poorest (social housing rents increased) to private tenants—and their landlords (increased accommodation supplement maximum payment). This was presented as an increase in equity. What a con; there was no “increase” in real terms. National-led Governments did not increase accommodation supplement thresholds to match rising rents during their entire time in Government from 2008-2017, and Labour updated them just once, in 2018. Neglecting indexation against inflation is standard practice in our benefits system. This was an overdue catch-up, it was not additional support.
To sum up: we have a long history of overinvestment in housing for capital gains. Looking ahead today, property investors face a dilemma: capital gains are over and house prices are so high that rents no longer provide a reasonable return on capital. Overseas share markets have higher returns, and recent changes made offshore investment simpler and more profitable. House prices are holding up mainly because sellers are reluctant to take a loss, so less properties are offered for sale.
I emphasise this problem for local landlords, because what happens next could increase the already grim situation for future renters. In the UK and the USA, large asset management firms like Blackrock have been buying up housing as a secure cash flow; they know people have no choice but to pay the rent. The results are measurable, particularly in aged care when tenancy charges go up but staffing is cut, so death rates increase. This is a new era of extreme wealth, and an extreme drive towards higher profits and higher cash extraction from tenants and consumers.
This is likely to be our future too, unless we reshape property markets and investment incentives to lower house prices and rents. We need more analysis and public discussion of our overpriced housing. Are we building enough new homes to keep up with population changes? Are there enough homes affordable for low and middle-income families? Are they suitable for today’s smaller households? And if not, what are our alternatives? This is the real story of our times. Life will keep getting worse until we talk more about where profit-before-people market solutions are taking us, and find new ways to counter extreme wealth and inequality.
Thanks to Child Poverty Action Group for funding this research; to Statistics New Zealand for their commitment to providing high quality data for research and safeguarding the confidentiality of individuals; to the Integrated Data Infrastructure team for their positive and professional support for researchers in the IDI data lab; to the Department of Engineering Science and Biomedical Engineering (Faculty of Engineering, University of Auckland) and the University of Canterbury for access to their data labs.
Access to the anonymised data used in this study was provided by Statistics NZ under conditions designed to give effect to the security and confidentiality provisions of the Data and Statistics Act 2022. The results presented in this study are the work of the author, not Statistics NZ or individual data suppliers. These results are not official statistics. They have been created for research purposes from the Integrated Data Infrastructure (IDI) which is carefully managed by Stats NZ. For more information about the IDI please visit https://www.stats.govt.nz/integrated-data/.
The results are based in part on tax data supplied by Inland Revenue to Statistics NZ under the Tax Administration Act 1994 for statistical purposes. Any discussion of data limitations or weaknesses is in the context of using the IDI for statistical purposes and is not related to the data’s ability to support Inland Revenue’s core operational requirements.
New Zealand’s private rental market always ranks as one of the least affordable of all Organisation for Economic Co-operation and Development (OECD) countries, with 24% of private renters paying more than 40% of their disposable income for rent in 2024 (OECD Affordable Housing Database HC1.2.3B: https://webfs.oecd.org/Els-com/Affordable_Housing_Database/HC1-2-Housing-costs-over-income.pdf)↩︎
Affordability is calculated as net income (rent + living costs), where living costs are based on NZ budgets for each household; technical explanations of the method can be found on the Child Poverty Action Group Website: https://www.cpag.org.nz/media-releases/cpag-analysis-of-affordable-rentals-shows-supply-isnt-keeping-up-with-population-growth↩︎
“Measuring The Cost Of Land Inputs To Housing Construction”; Gooper, Greenaway-McGrevy & Jones, New Zealand Economic Papers (2026, Vol 60-1). https://www.tandfonline.com/doi/full/10.1080/00779954.2025.2536257↩︎
“Regional Variation In Rental Price Inflation”; Ryan Greenaway-McGrevy and Yun So, Policy Quarterly, May 2026. https://ojs.victoria.ac.nz/pq/article/view/10729↩︎
Watchdog 172 -- August 2026
Non-Members:
It takes a lot of work to compile and write the material presented on these pages. If you value the information, please send a donation to the address below to help us continue the work.
Foreign Control Watchdog, PO Box 2258, Christchurch, New Zealand/Aotearoa.
Email