POVERTY UPDATE
Regional Trends In Affordable Rental Supply
- Greg Waite
In Watchdog 163 (August 2023) I made the connection between poverty and rental affordability; households in private rental are the most likely to be in poverty, including many who work for low wages. In the previous issue, Watchdog 164 (December 2023), I summarised research on the supply of affordable rental homes in New Zealand.
This issue I'm summarising research funded by the Child Poverty Action Group (CPAG) which looked at our housing stock - changes in the share of affordable properties over time and regions - to tell us more about the supply side. Too often we look only at the big picture to measure affordable housing, typically the overall share of New Zealand's households who can afford their rental homes.
Behind that one number lie complex changes in earned incomes, benefits, the unemployment rate, and the cost of housing stock. And because New Zealand governments favour free market solutions, not enough work is done to analyse our overpriced housing and inform solutions. Are we building enough new rental homes? Are they affordable for middle income families? For low income families? Are we losing affordable old homes to redevelopment?
The conclusions were:
- The number of people who need homes is growing much faster than the rental supply;
- The share of rentals which is affordable is shrinking in most areas;
- These declines in affordable supply over the last five years disproportionately impact households on the lowest incomes and in areas with lower rents;
- Only one-bedroom flats in more expensive areas have supply close to meeting demand.
This article takes a more detailed look at our declining supply of affordable private rental homes, asking which regions and local government areas are most affected. It's important to see how this local picture plays out, because housing planning is debated locally and relies on council action to change existing trends.
Measurement Of Affordable Rental Housing Stock
Affordable rents for the family sizes which typically occupy one, two, three and four bedrooms were calculated to count the supply of rental homes which are affordable at three income levels: median wages, low wages (minimum wage up to Living Wage) and benefits. Here I have only shown the trends for households on the median wage to emphasise that losses of affordable rental supply affect all households, not just the poorest. Affordability is calculated based on full time work for singles, one and a half full time wages for couples with children, and two wages for couples only.
The table below shows changes in the share of our rental stock which was affordable in 2018 and 2023, i.e. whether current policies are resulting in a greater or lesser proportion of the total rental stock being affordable over that period. The stock of affordable homes can change for many reasons including increased rents, loss of existing affordable homes to redevelopment, new affordable homes being built, etc. These tables provide a measure of the overall change in supply of affordable rental.
Regional Trends
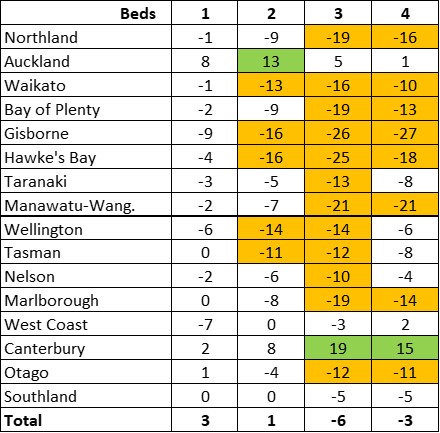
Table 1. Change in the percent of affordable rental by Region and Bedrooms, 2018-2023
Table 1 above shows how the proportion of all private rentals which is affordable (%) has changed from 2018 to 2023. For example, the 19% fall in the proportion of affordable 3-bedroom rental stock in Northland shown on line one of the table results from 81% of 3-bedroom rental being affordable in 2018, falling to just 62% in 2023 (81-62=19%). The detail for each year is not shown to keep the table readable and focus on the trend.
Falls and increases of 10% or more are highlighted in orange and green. Clearly most regions are experiencing a shrinking share of affordable rental housing. The only notable exceptions are Canterbury and Auckland, which have both had more new construction of smaller homes. The overall increases in the national share of affordable one and two bedroom rentals (by 3% and 1%, last line of table) largely results from the increases in the two large cities of Auckland and Christchurch, but these increases were not enough to meet the increase in demand. New Zealand’s population growth over this same five-year period was 8%.
Local Government Trends
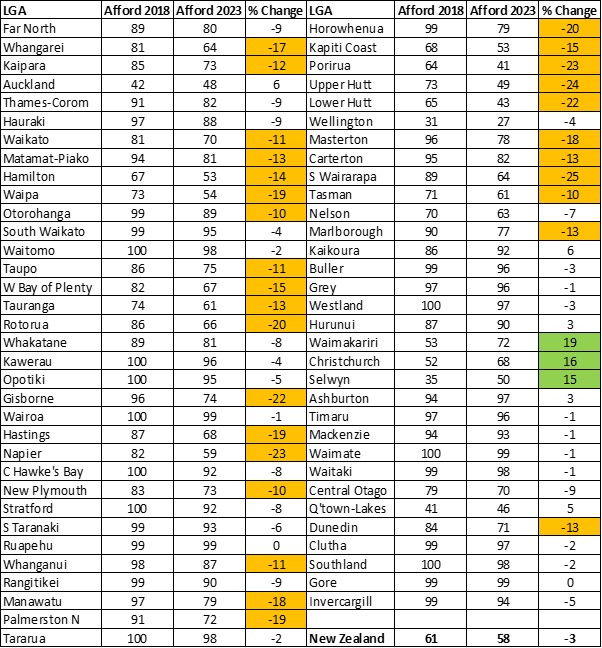
Table 2. Change in the percent of affordable rental by Local Government Authority, 2018-2023
We Need New Regulations To Create Liveable Housing
A reminder: this table looks at the share of rental housing which is affordable on the median household income. That is why in 2018 all rental (100%) was affordable in places like Kawerau and Waimate - if you had income at the national median. By 2023 though, no local government area could claim 100% affordable rental. A clear majority see declines, but there is also a lot of variation, from the 25 percentage point drop in South Wairarapa to the 19 percentage point rise in Waimakariri.
That net change results from the combination of local and national factors: speculative overinvestment driving up prices, employment and population increases or decreases affecting demand, the relative profits from building high-end or low cost housing, earthquakes and floods - and the lack of national and local Government action to match housing demand to supply. As long as New Zealand has high housing costs and high population growth, we need to both increase the share of housing which is affordable, and grow the total supply to match net migration. Unfortunately, we did not achieve either between 2018 and 2023.
Leaving housing "to the markets" means leaving house prices and rents to a particular type of market, one designed to extract more profit from home owners, renters and Government tax subsidies. We need new regulations from both local and national Governments to create liveable housing in Aotearoa. Get involved and demand more from your council and your party of choice.
Acknowledgements
My thanks to Statistics New Zealand for its' commitment to providing high quality data for research and safeguarding the confidentiality of individuals; to the Integrated Data Infrastructure team for their positive and professional support for researchers in the IDI datalab; to the Child Poverty Action Group for funding this research; to Alan Johnson and Gerry Cotterell for their very helpful advice on the drafts; to Mike O'Sullivan, Cameron Walker and the Department of Engineering Science and Biomedical Engineering (Faculty of Engineering, University of Auckland) for access to their data lab on evenings and weekends; and to everyone who provided advice and contacts to support this analysis.
Statistics NZ Disclaimers
Integrated Data Infrastructure (IDI): These results are not official statistics. They have been created for research purposes from the IDI which is carefully managed by Stats NZ. For more information about the IDI please visit Stats NZ.
Census: Access to the data used in this study was provided by Stats NZ under conditions designed to give effect to the security and confidentiality provisions of the Data and Statistics Act 2022. The results presented in this study are the work of the author, not Stats NZ or individual data suppliers.
IRD: The results are based in part on tax data supplied by Inland Revenue to Stats NZ under the Tax Administration Act 1994 for statistical purposes. Any discussion of data limitations or weaknesses is in the context of using the IDI for statistical purposes, and is not related to the data's ability to support Inland Revenue's core operational requirements.
Watchdog - 165 April 2024
Non-Members:It takes a lot
of work to compile and write the material presented on these pages - if
you value the information, please send a donation to the address below to
help us continue the work.
Foreign Control Watchdog, P O Box 2258, Christchurch, New Zealand/Aotearoa.
Email